Who is this article for?
Is your practice getting busier? Which practitioner or appointment type is the most booked? How many appointments end as no-shows or cancellations? The Appointments charts of the Analytics dashboard follow your activity over time.
This article explains each appointment chart, what it counts, and how to read your no-show rate.
Before you start: the Analytics dashboard is available to team members with the Administrator role. It is not included in the Starter plan (it is available during the free trial).
1Open the appointment charts
- Click the Analytics icon (bar chart) in the top bar, or go to www.colib.io/establishmentanalytics.
- In Filters, choose the Appointments Category. The All appointments chart opens.
- Choose another Chart if needed (see the table below), and set the period with the Quick Select buttons or the Start Date and End Date.
| Chart | What it shows |
|---|---|
| All appointments | The number of appointments of each day, week or month, whatever their status (cancellations and no-shows included). |
| Per practitioner | One line per practitioner: the number of appointments of each practitioner. |
| Per appointment type | One line per appointment type: which services are booked the most. |
| Per status | One line per status: Scheduled, Confirmed, Completed, Rescheduled, Cancelled, Late-cancelled and No-Show. |
| Per clinic | One line per clinic. Only shown in practices with several clinics, to administrators who have access to all the clinics. |
| 'No-show' rate | The percentage of the appointments of each period that are marked as no-shows (see step 3). |
2Follow the number of appointments
- With the All appointments chart, choose a long period such as Last 12 Months and group it by Month in the Period list to see the trend.
- Group by Week or Day for a shorter period, for example to compare the weeks of a month.
- Move the mouse over a point to see the exact number of appointments of that period.
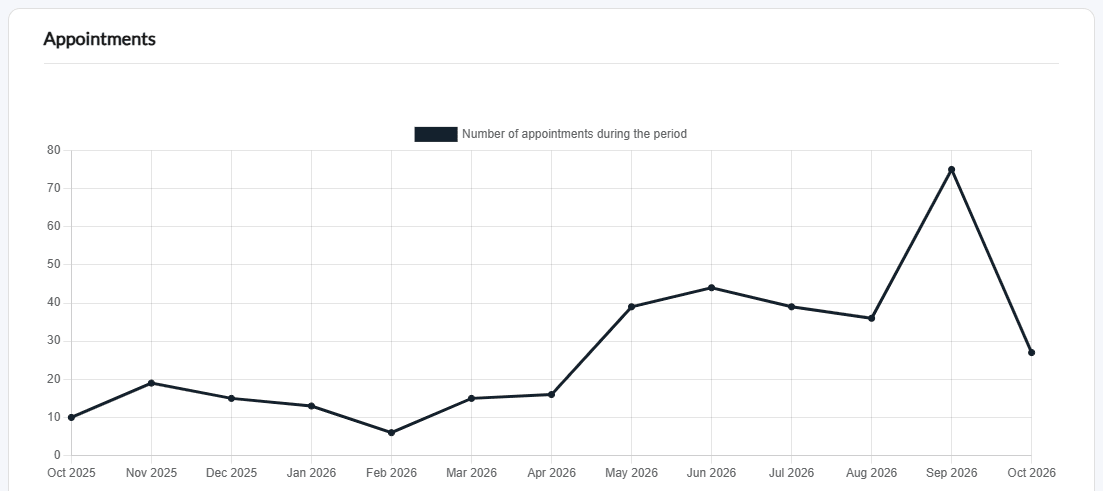
An appointment is counted in the period of its start date. Only appointments are counted: the other events of your scheduler (Busy, Other and Task events) are not.
3Read your no-show rate
- Choose the 'No-show' rate chart.
- Each point gives the Percentage of no-shows during the period: the appointments marked No-Show divided by all the appointments of that period (cancelled ones included).
- A high rate on some months may call for reminders or a cancellation policy.
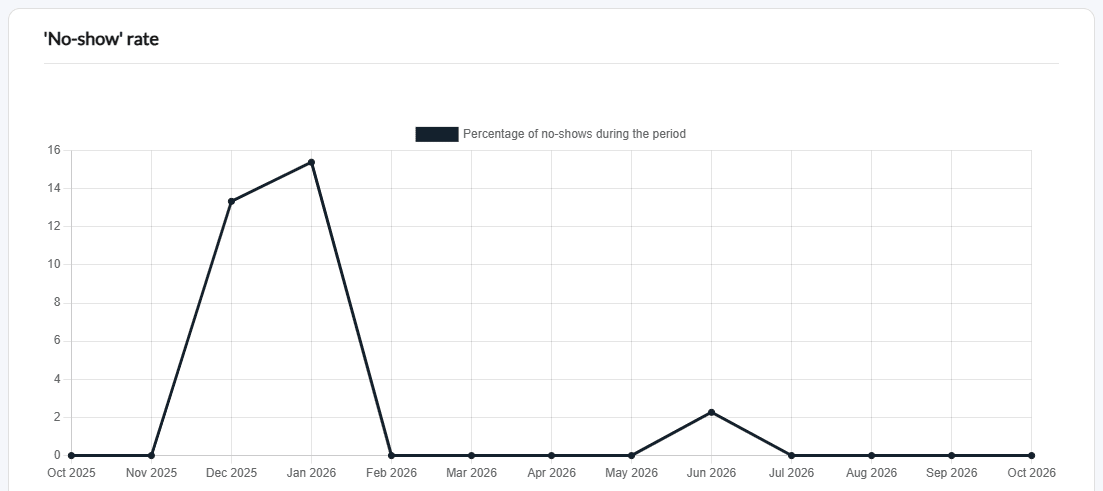
The statuses come from what your team records in the scheduler. An appointment that was missed but never marked as a no-show is not counted in the rate.
Good to know
- Hide a line — on the charts with several lines, click a name in the legend above the chart to hide or show that line.
- Raw data and Excel export — the All appointments and 'No-show' rate charts have a Raw Data table and an Export to Excel button. The charts with one line per practitioner, type, status or clinic have no raw data table.
- Not the count of your plan — to know how many appointments your plan has counted this period, see How can I see the number of appointments I made during the current period?
- Cancellations and no-shows — see How to cancel an appointment: for practitioners and clients and How to charge no-shows and late cancellation appointments.
- Upcoming appointments — to estimate the revenue of the appointments already booked, see the article titled "How to see your revenue and projected revenue in Analytics".
- Related articles — please see the article titled "How to read the Analytics dashboard", the article titled "How to filter Analytics and who can see it".
Still have a question?
Write to us at support@colib.io, we will be happy to help.
Was this article helpful?
That’s Great!
Thank you for your feedback
Sorry! We couldn't be helpful
Thank you for your feedback
Feedback sent
We appreciate your effort and will try to fix the article