Who is this article for?
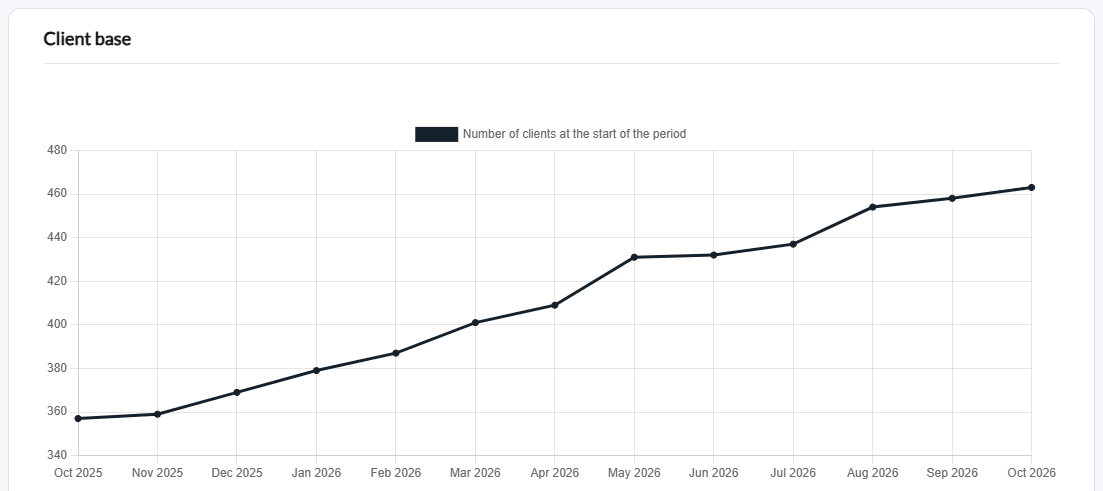
Is your client base growing, and how fast? The Client base chart of the Analytics dashboard shows how many active clients your practice has over time.
This article explains what the chart counts, how to read your growth and your new clients, and what the chart does not count.
Before you start: the Analytics dashboard is available to team members with the Administrator role. It is not included in the Starter plan (it is available during the free trial).
1Open the Client base chart
- Click the Analytics icon (bar chart) in the top bar, or go to www.colib.io/establishmentanalytics.
- The dashboard opens directly on the Clients category and the Client base chart, for the last 12 months (or since your account was created, if it is more recent), grouped by month.
- To look further back, click Last 24 Months or choose a Start Date, then click Apply Filters.
2Read the chart
- Each point is the Number of clients at the start of the period: the clients whose record already existed at the start of that day, week or month, and who are active today.
- A rising curve means your client base is growing.
- New clients: the difference between two points is the number of client records added between those two dates that are still active. For example, if the chart shows 380 clients at the start of January and 387 at the start of February, 7 new clients were added in January.
- Move the mouse over a point to see its exact value, or read the Raw Data table under the chart.
3Narrow it down or export it
- Change the grouping in the Period list: Month for a long-term trend, Week or Day to see the growth of a short period.
- If your practice has several clinics, choose a Clinic to count only the clients attached to that clinic.
- Click Export to Excel, above the Raw Data table, to download the value of each period.
What the chart does not count
- Archived and deleted clients — only active client records are counted, for every period shown. When you archive a client, that client also disappears from the past points of the chart: the curve shows the history of your current clients, not the number you had on that date.
- Activity — a client counts whether they came recently or not. To follow your activity, use the Appointments charts (see the article titled "How to follow your appointments in Analytics").
Good to know
- One chart for clients — the Clients category contains the Client base chart only. Your clients also appear in the other charts through their appointments, invoices and forms.
- Archive a client — see How to archive a client.
- Related articles — please see the article titled "How to read the Analytics dashboard", the article titled "How to filter Analytics and who can see it".
Still have a question?
Write to us at support@colib.io, we will be happy to help.
Was this article helpful?
That’s Great!
Thank you for your feedback
Sorry! We couldn't be helpful
Thank you for your feedback
Feedback sent
We appreciate your effort and will try to fix the article