Who is this article for?
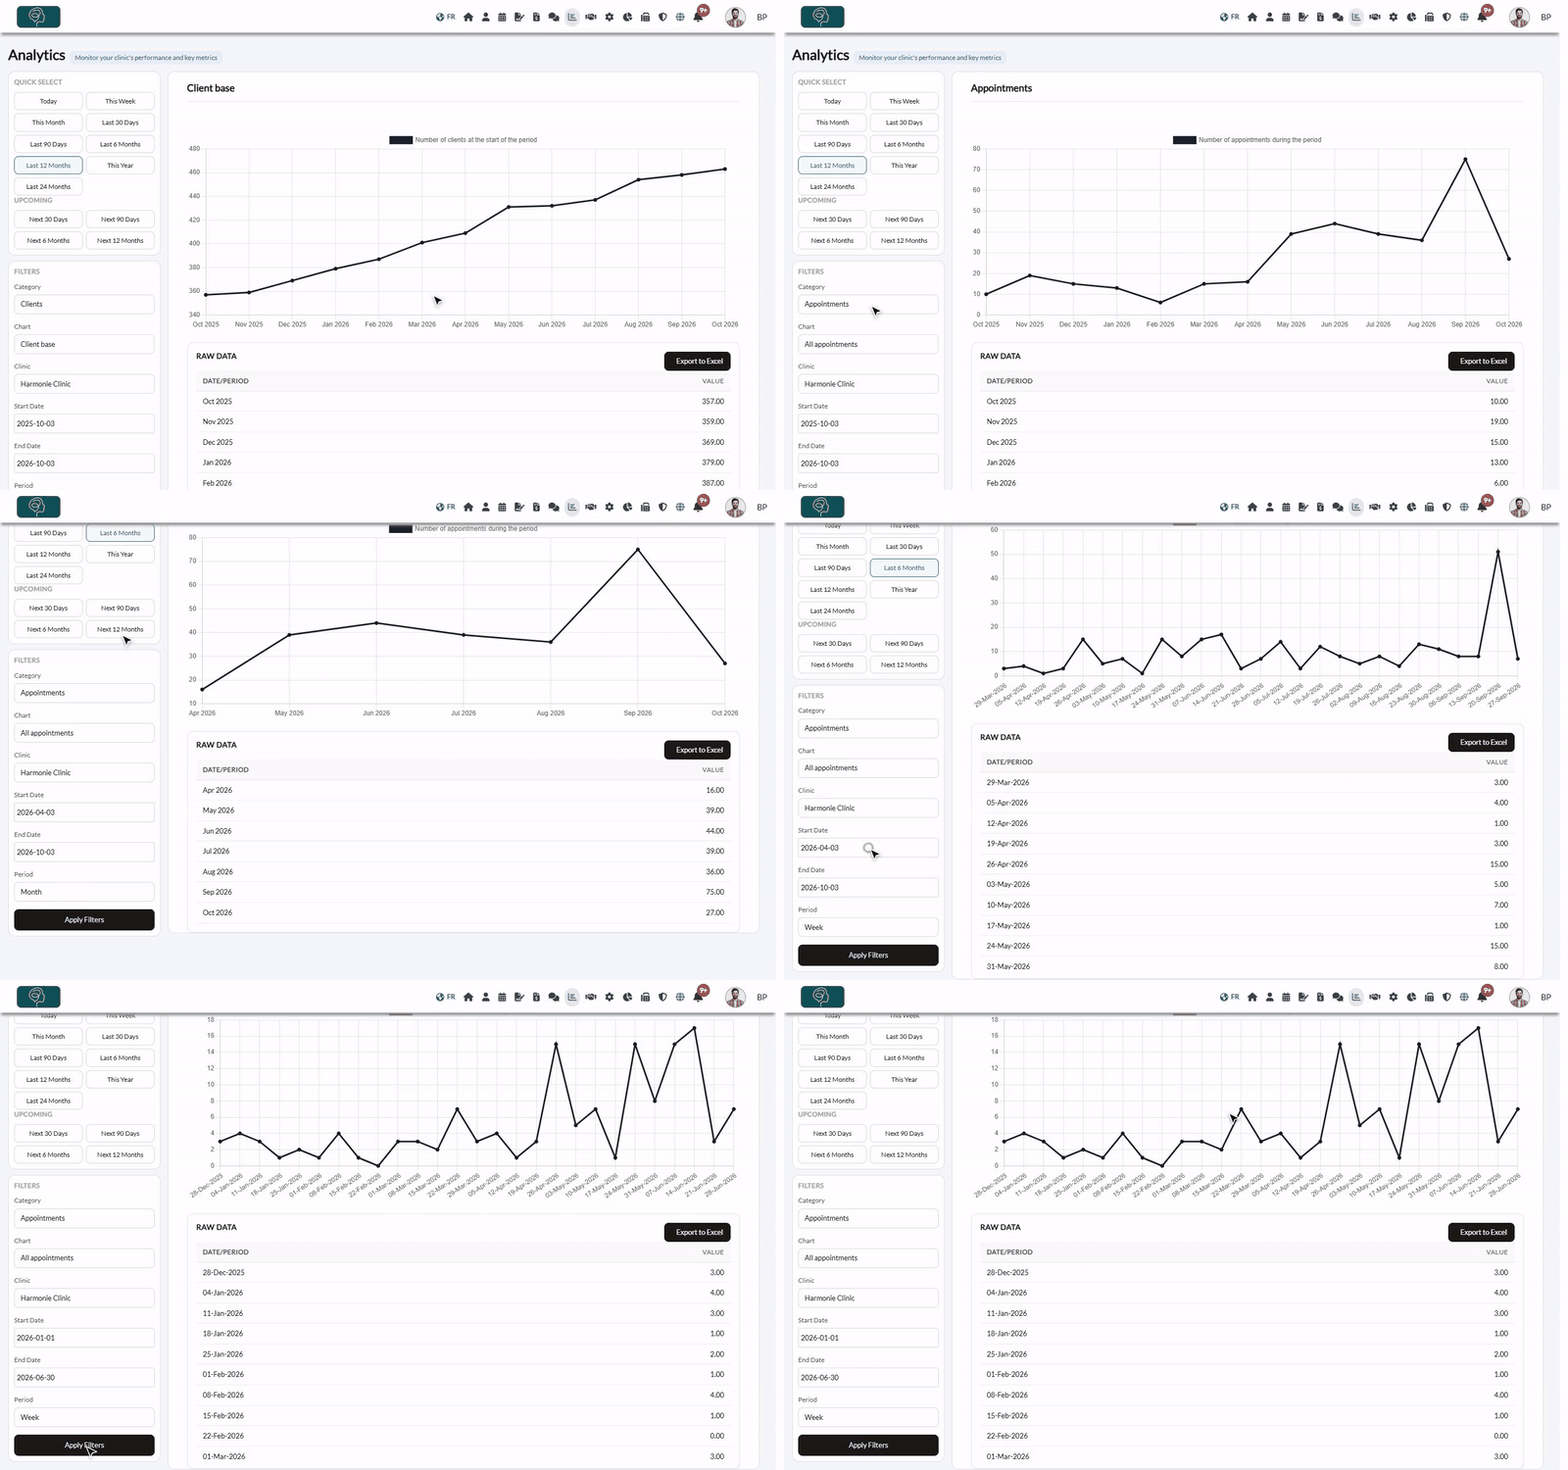
Every chart of the Analytics dashboard can be narrowed to a period, grouped by day, week or month, and, in a practice with several clinics, limited to one clinic. This article explains each filter, how to export the numbers, and who in your team can see the dashboard.
Before you start: open the dashboard with the Analytics icon (bar chart) in the top bar, or go to www.colib.io/establishmentanalytics. If you do not see the icon, read the section Who can see Analytics below.
1Choose a chart
- In the Filters panel on the left, choose a Category: Clients, Appointments, Finances (CAD), Forms or Gift certificates and products.
- Choose a Chart in this category. The chart is redrawn right away.
2Pick a period in one click
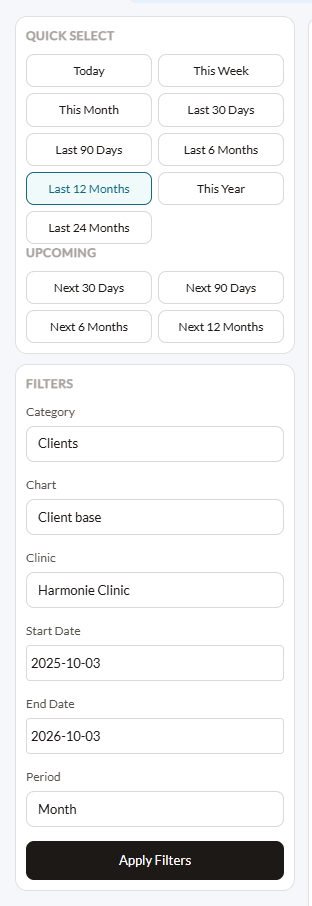
When you open the dashboard, the period covers the last 12 months (or the time since your account was created, if it is more recent). Click a button to change it; the chart is updated right away and the dates are filled in for you.
| Button | Period |
|---|---|
| Today | Today only. |
| This Week | From Monday to Sunday of the current week. |
| This Month, This Year | The whole current month, or the whole current year (January 1 to December 31). |
| Last 30 Days, Last 90 Days, Last 6 Months, Last 12 Months, Last 24 Months | The period that ends today. |
| Upcoming: Next 30 Days, Next 90 Days, Next 6 Months, Next 12 Months | The period that starts today. Use these buttons with the projected revenue charts. |
3Choose your own dates
- Click Start Date and pick a date in the calendar.
- Click End Date and pick a date.
- Click Apply Filters. Unlike the other filters, the dates are only applied when you click this button.
4Group the points by day, week or month
- In the Period list, choose Day, Week or Month (the default).
- The chart shows one point per day, week or month. Weeks start on Sunday, and each point is labelled with the first day of its week or month.
The Revenue per practitioner and appointment type chart is the exception: it always shows the total of the whole period, one bar per practitioner.
5Filter by clinic (practices with several clinics)
- The Clinic list only appears when your practice has several clinics.
- If you have access to all the clinics, leave -- Select -- to see the whole practice, or choose one clinic. You also get the Per clinic and Invoices per clinic (payment date) charts, which compare your clinics.
- If you are attached to some clinics only, the list only offers your clinics, one at a time, and the charts never include the other clinics.
To learn how clinics are assigned to your team, see How does creating multiple clinics affect practitioners' rights? and How do filters change in Colib after creating several clinics?
What about practitioners?
There is no practitioner filter: the charts show the figures of the whole practice (or of the selected clinic), for all practitioners. To compare your practitioners, use the charts made for that: Per practitioner (appointments), Revenue per practitioner, Revenue per practitioner and appointment type, Invoices per practitioner (payment date) and Projected revenue per practitioner. On a chart with several lines, click a name in the legend to hide or show that line, and move the mouse over the chart to read the values of every line at that date.
Export the numbers
- Under most single charts, the Raw Data table lists the value of each period. Click Export to Excel to download it: the file contains the chart title, then one row per day, week or month, calculated with the filters you selected (period, grouping, clinic).
- For charts with two lines (for example revenue and taxes), the table and the file give the first value only (here, the revenue without taxes).
- The Revenue per practitioner and appointment type table is exported with its rows, columns and totals.
- Charts with one line per practitioner, type, status, clinic or form have no raw data table and cannot be exported.
- There is no button to download a chart as an image: to keep a picture of it, take a screenshot with your computer.
- Each export is recorded in your practice's audit log.
Who can see Analytics
| Condition | Details |
|---|---|
| Role | The Analytics icon appears for team members whose Role is Administrator. Team members with the Staff role do not have it. To change a role, go to Settings > Team (www.colib.io/settings?show=team), click the pencil icon on the team member's row, then choose the Role. |
| Plan | The dashboard is not included in the Starter plan. It is available during the free trial and on the other plans. Without it, the icon is hidden and opening the page takes you to your scheduler. To change your plan, click Plan in the top bar (www.colib.io/planandpayments). |
| Clinics | In a practice with several clinics, an administrator attached to some clinics only sees the figures of those clinics (see step 5). |
Important: an administrator sees the revenue, invoices and activity of all the practitioners of the clinics they have access to. Give the Administrator role only to the people who should see these figures.
Good to know
- Settings > Analytics — this tab (www.colib.io/settings?show=analytics) is not the dashboard: it is where you connect Google tools to measure the visits to your booking page. See How to connect Google Analytics, Google Ads and Google Tag Manager to Colib.
- Accounting reports — for figures to give your accountant (taxes collected, payment provider fees, amounts in all currencies, PDF exports), use the Reports section (www.colib.io/reports). See the article titled "How to use the Reports section".
- Plans — see How does payment for Colib plans work?
- Related articles — please see the article titled "How to read the Analytics dashboard", the article titled "How to see your revenue and projected revenue in Analytics", the article titled "How to follow your appointments in Analytics", the article titled "How to follow your client base in Analytics", the article titled "How to follow your forms in Analytics".
Still have a question?
Write to us at support@colib.io, we will be happy to help.
Was this article helpful?
That’s Great!
Thank you for your feedback
Sorry! We couldn't be helpful
Thank you for your feedback
Feedback sent
We appreciate your effort and will try to fix the article