Who is this article for?
How much did you collect last month? Which practitioner or appointment type brings in the most? How much can you expect from the appointments already booked? The Finances (CAD) charts of the Analytics dashboard answer these questions.
This article explains what each finance chart counts, how to read your revenue, and how the projected revenue of your upcoming appointments is calculated. For a general tour of the dashboard, see the article titled "How to read the Analytics dashboard".
Before you start: the Analytics dashboard is available to team members with the Administrator role. It is not included in the Starter plan (it is available during the free trial). The finance charts only count amounts in Canadian dollars (CAD).
1Open the finance charts
- Click the Analytics icon (bar chart) in the top bar, or go to www.colib.io/establishmentanalytics.
- In Filters, choose the Finances (CAD) Category.
- Choose a Chart (see the table below), then set the period with the Quick Select buttons or the Start Date and End Date.
| Chart | What it shows |
|---|---|
| Revenue based on the payment date | The invoices paid over each period, counted on their payment date: one line for the revenue without taxes, one line for the taxes. |
| Revenue per practitioner | One line per practitioner: the total of the paid invoices of that practitioner, taxes included, on their payment date. |
| Revenue per practitioner and appointment type | For the whole selected period: one bar per practitioner, split by the appointment type of the appointments the invoices cover (taxes included), with a table of the amounts and the totals. Invoices that are not linked to an appointment are grouped under N/A. |
| Invoices based on the payment date | The number of invoices paid over each period and their sum (taxes included). |
| Invoices based on the invoice date | The number of invoices dated in each period and their sum, whether they are paid or not. Draft invoices are not counted. |
| Invoices per practitioner (payment date) | The amount of the paid invoices per practitioner, taxes included, on their payment date. |
| Invoices per clinic (payment date) | The amount of the paid invoices per clinic. Only shown in practices with several clinics, to administrators who have access to all the clinics. |
| Projected revenue (upcoming appointments), Projected revenue per practitioner, Projected revenue per appointment type | What you can expect to collect from the appointments already in your scheduler (see step 3). |
2Read your revenue
- Choose the Revenue based on the payment date chart and a period, for example Last 12 Months, grouped by Month in the Period list.
- The dark line is the Revenue without taxes ($), read on the left scale. The blue line is the Taxes ($), read on the right scale.
- Move the mouse over a point to see the exact amounts of that day, week or month.
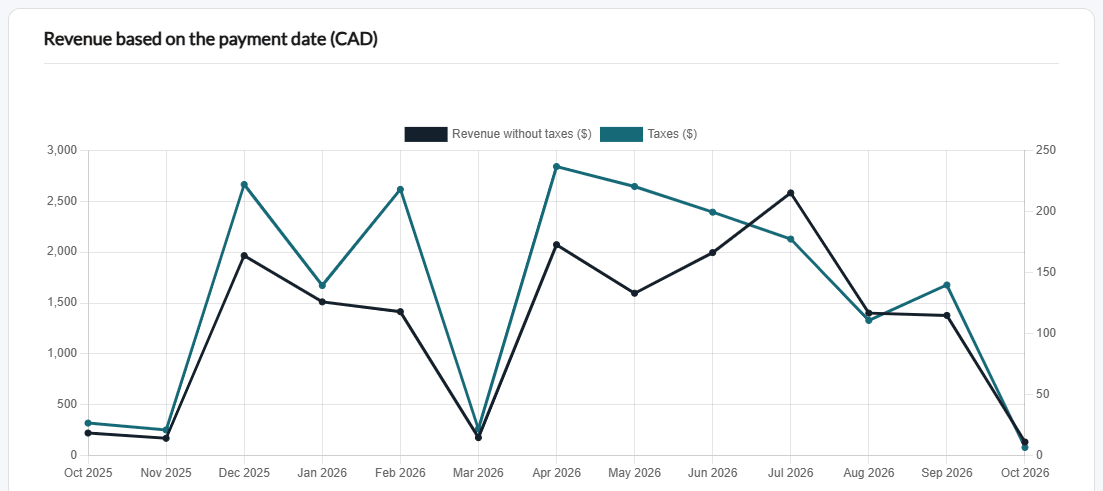
An invoice counts in your revenue once it is fully paid (status Paid), on its payment date. A partially paid invoice is not counted yet. To check or change the status of an invoice, see How to change the status of an invoice.
3See your projected revenue
- Choose the Projected revenue (upcoming appointments) chart. If the selected period is already over, the dashboard switches by itself to the next 90 days.
- Use the Upcoming buttons to look further ahead: Next 30 Days, Next 90 Days, Next 6 Months or Next 12 Months. You can also pick an End Date in the future and click Apply Filters.
- Read the two cards above the chart: Projected revenue without taxes (CAD) for the whole period (with the dates used), and the number of Upcoming appointments. The chart shows the amount (left scale) and the number of appointments (right scale) for each day, week or month.
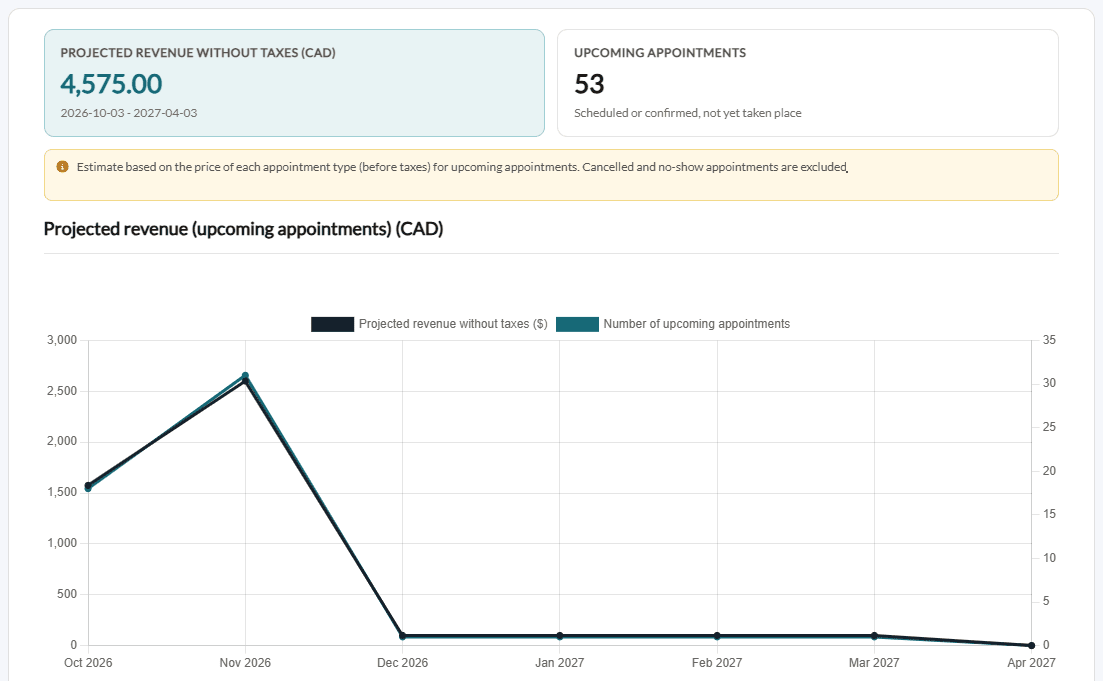
The Projected revenue per practitioner and Projected revenue per appointment type charts split the same estimate by practitioner or by type, with the total in the main card.
How the projected revenue is calculated
| Rule | Details |
|---|---|
| Appointments counted | The appointments of your scheduler that have not started yet, within the selected period. The period never starts before today. |
| Appointments excluded | Appointments marked as Cancelled, Late-cancelled or No-Show, and appointments without an appointment type. |
| Amount of an appointment | The Price of its appointment type, before taxes, multiplied by the number of clients of the appointment (a group appointment with 4 clients counts 4 times the price). A type without a price counts for 0. |
An estimate, not an invoice: the projection uses the current price of each appointment type. The amounts you actually invoice can differ (discounts, extra items, price changes, cancellations to come). To set the price of your appointment types, see How can I view my appointment types and manage/edit them as needed?
Good to know
- Canadian dollars only — invoices in another currency are not counted in the finance charts. For your accounting, your taxes and amounts in other currencies, use the Reports section (www.colib.io/reports), whose reports can be exported to Excel and PDF (see the article titled "How to use the Reports section").
- With or without taxes — the Revenue based on the payment date chart separates the revenue without taxes from the taxes. The per-practitioner, per-clinic and per-type charts, and the invoice charts, show amounts taxes included.
- Raw data and Excel export — under a single chart, the Raw Data table and the Export to Excel button give the first value of the chart for each period: the revenue without taxes, the number of invoices, or the projected revenue. The Revenue per practitioner and appointment type table can be exported as well. Charts with one line per practitioner, per appointment type or per clinic have no raw data table.
- Missed appointments — to bill no-shows and late cancellations, see How to charge no-shows and late cancellation appointments.
- Related articles — please see the article titled "How to read the Analytics dashboard", the article titled "How to follow your appointments in Analytics", the article titled "How to filter Analytics and who can see it".
Still have a question?
Write to us at support@colib.io, we will be happy to help.
Was this article helpful?
That’s Great!
Thank you for your feedback
Sorry! We couldn't be helpful
Thank you for your feedback
Feedback sent
We appreciate your effort and will try to fix the article